


Are you looking to grow your business on Twitter, but struggling to keep track of how well you are actually doing?
Today on Put a Pin in It, Andrea Tremper shows you how to check in on your most important numbers.
Video Transcription
Like most other social media platforms, Twitter‘s interface gives you a few obvious indicators of your performance. If you’ve got a lot of likes or retweets on your posts, it’s safe to say that people are engaged. If you keep getting new followers, people are interested in your product or, at the very least, they like what you have to say.
But, like other social media platforms, Twitter also does offer a more detailed look at your numbers, all in one place. And that place is the analytics section. The good news is it’s actually really easy to access this useful information. First, you’ll need to go to analytics.twitter.com, or you can click your avatar in the top right corner and, on the drop-down menu, click Analytics.

Just a quick heads-up: if this is your first time using this part of the site, you’ll need to click the box on the next page that says “Turn on Analytics.” Once you’ve done that, the first page that will pop up is your personal analytics home page. Here, you automatically see the rundown of the most important stats for the last 28 days.
This page will tell you how many times you’ve tweeted in the last 28 days. And then there’s also tweet impressions. This will tell you how many feeds your tweets have appeared in. You can also see how many times people have visited your profile and how many times someone has mentioned you or tagged you. All of these stats are accompanied by a green number, which indicates an increase over the past 28 days, or a red number, which indicates a decrease over the last 28 days.
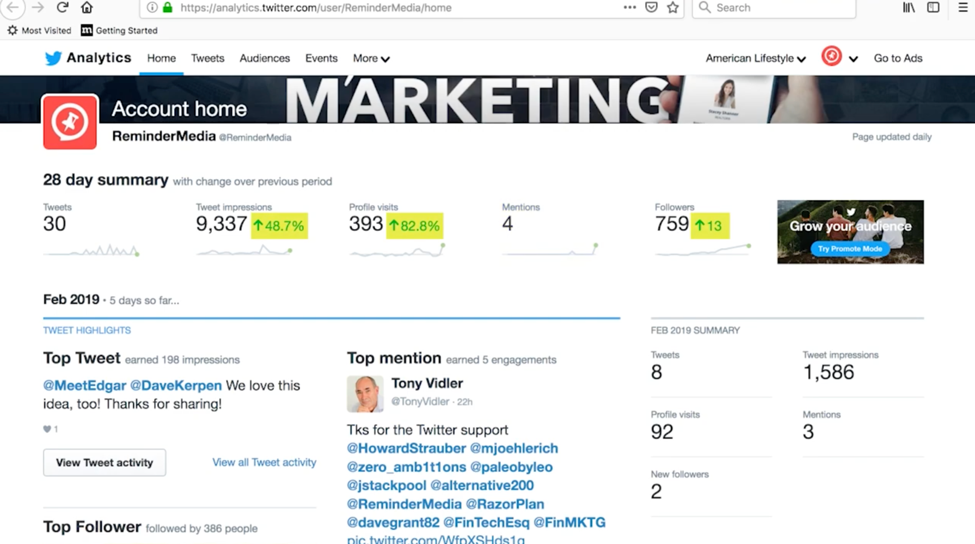
If you scroll down, you’ll see your top performing tweets for the current month, as well as other relevant information—like the most engaging tweet you were mentioned in and the most notable person who followed you this month. On the right side of the page, you can also see how many new followers you’ve received over the course of the month. Keep scrolling down the page, and the analytics will load this information for previous months.
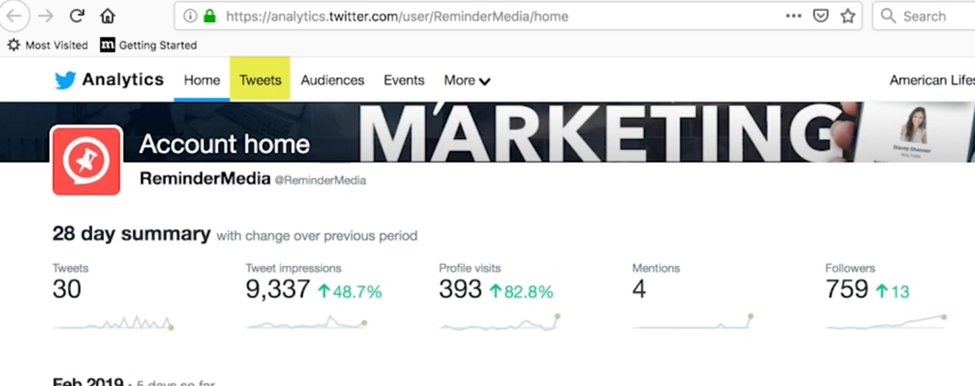
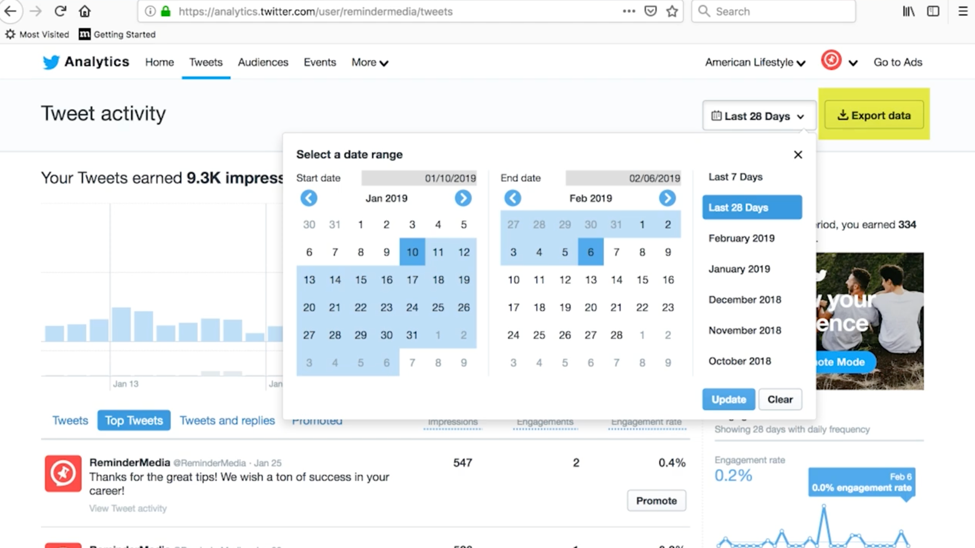
If you’re looking for a more bird’s eye view of all of your analytics, click the Tweets link at the top of your page. Here you’ll see each tweet that you made over the last 28 days. Right next to it, you’ll see the impressions and engagement each one received. The third number is the engagement rate, or the total amount of engagements per 100 impressions.
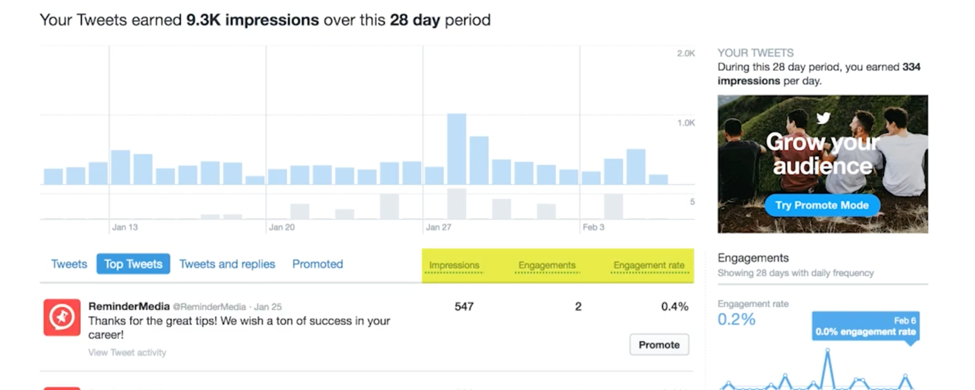
There are also some other cool features here, too. If you click Tweets and Replies, you’ll also see the numbers for replies you’ve made to other people’s tweets. Top Tweets shows you your best performing tweet from the period. And, if you’ve paid to advertise on Twitter, you can actually see your Promoted Tweets here, as well. For now, let’s stick with the main tweets menu.
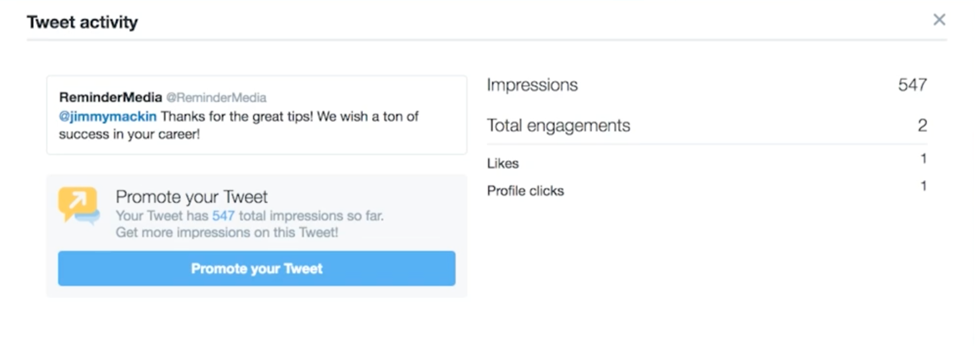
From this big list of recent tweets, you can actually click on an individual one and get a detailed view of its performance. Here, you’ll see all the types of engagement your tweet received, including the number of clicks, the number of likes, and number of retweets.
If you’d like to see tweets from a previous period, just head up to the drop-down at the top, where it says last 28 days. You can pick your period and date range there, or you can also select to export your data to download a spreadsheet of your numbers for a given period.
The takeaway
And that’s it! Now that you know how to view your tweets and analytics, you can figure out which tweets did well and which ones didn’t do quite so well, so you can figure out how to do better next time. If you liked all of this information, comment below. Make sure to follow us on Twitter, Instagram, and Facebook: @remindermedia. But, most importantly, put a pin in it.