


Are you keeping a close eye on the performance your Facebook ads? If not, you should be—otherwise, you risk wasting money on expensive campaigns that get you little return on your investment.
Today on Put a Pin in It, Andrea Tremper shows you how to check your most important numbers and use that information to guide your future ad campaigns.
Video Transcription
Targeted Facebook ads can be one of the cornerstones of your digital marketing efforts, but only if you go in with a game plan. A big part of doing that is checking in to see how your ads are performing, so you can do more of what works and less of what doesn’t.
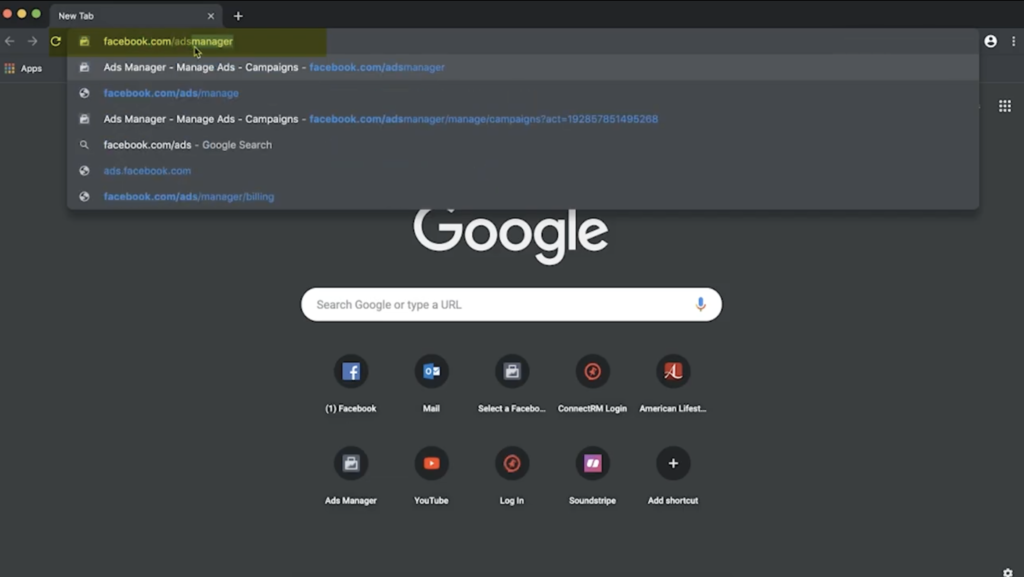
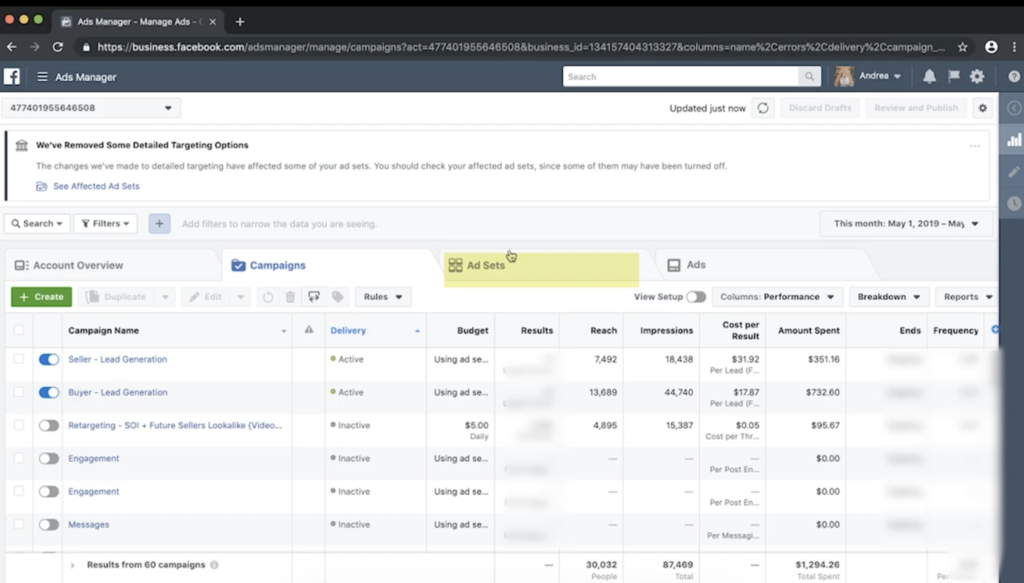
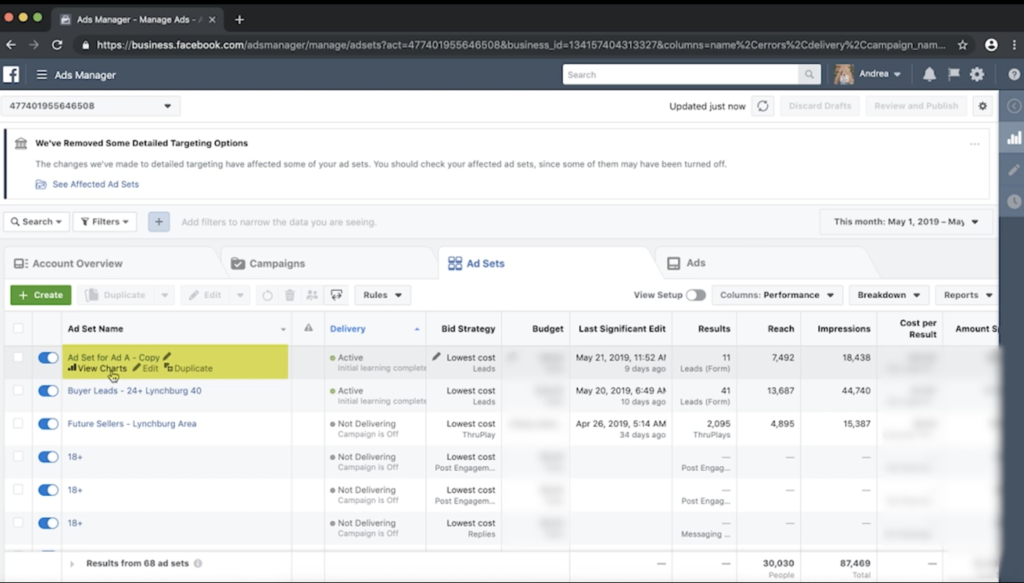
To get started, open your browser and visit facebook.com/adsmanager. By default, this view is going to show you all of your current ads, as well as past ads. To see the different ads, you can either view at the campaign level—which is the default setting—or view individual ads under Ads Sets. Once you decide which ad you want to see, click View Charts.
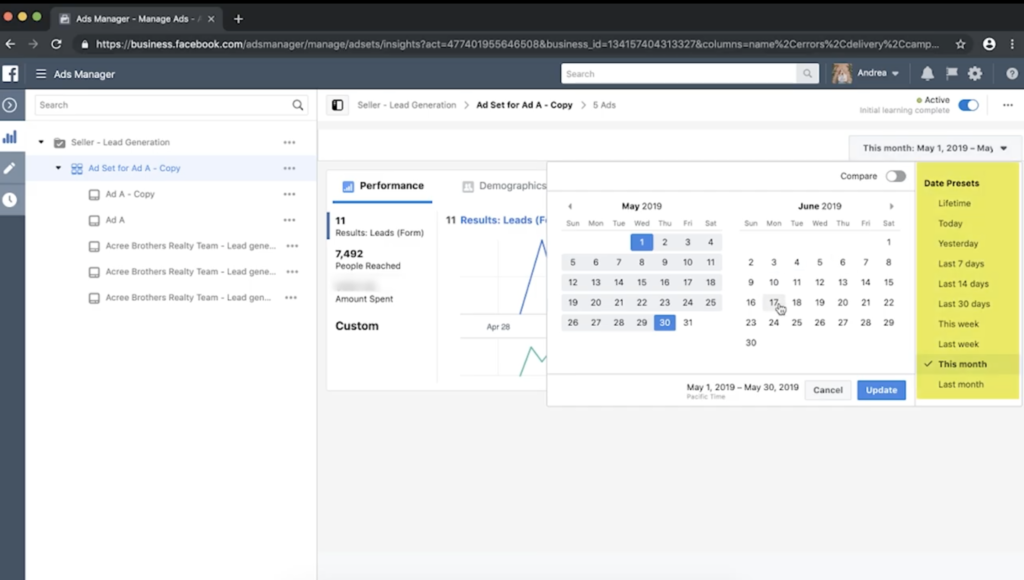
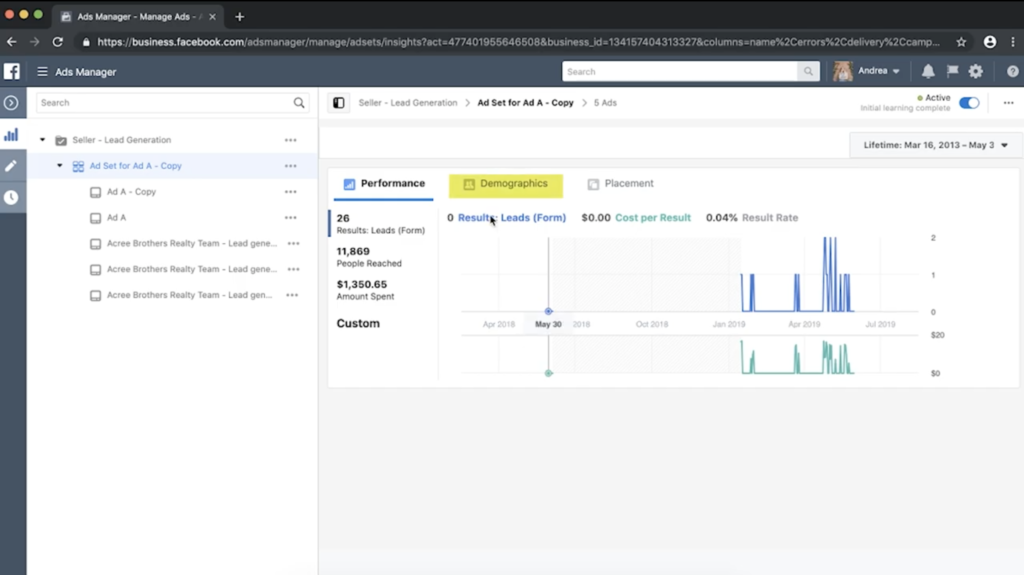
Here, you’re going to see how well the ad has performed in the last 30 days. But you can actually change the timeframe by clicking the drop-down menu in the top right corner. I’m going to choose Lifetime so I can see the entire history of the ad.
On the left, Facebook will list the People Reached, the Amount Spent, and the Desired Outcome. Depending on which type of ad you ran, there are a lot of different objectives you can run—page likes, reach, traffic to your website. It all depends on what your goals are for your ad.
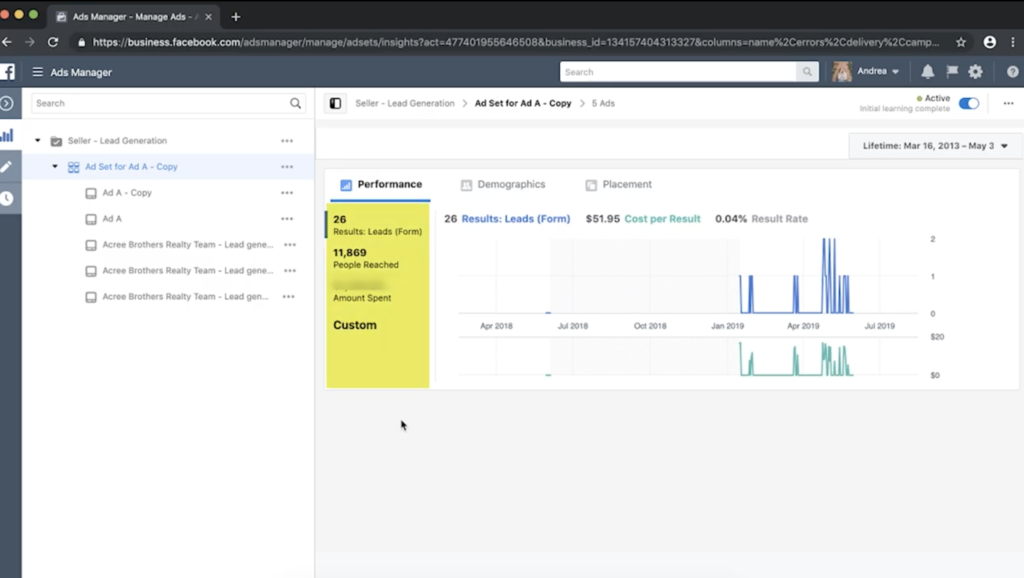
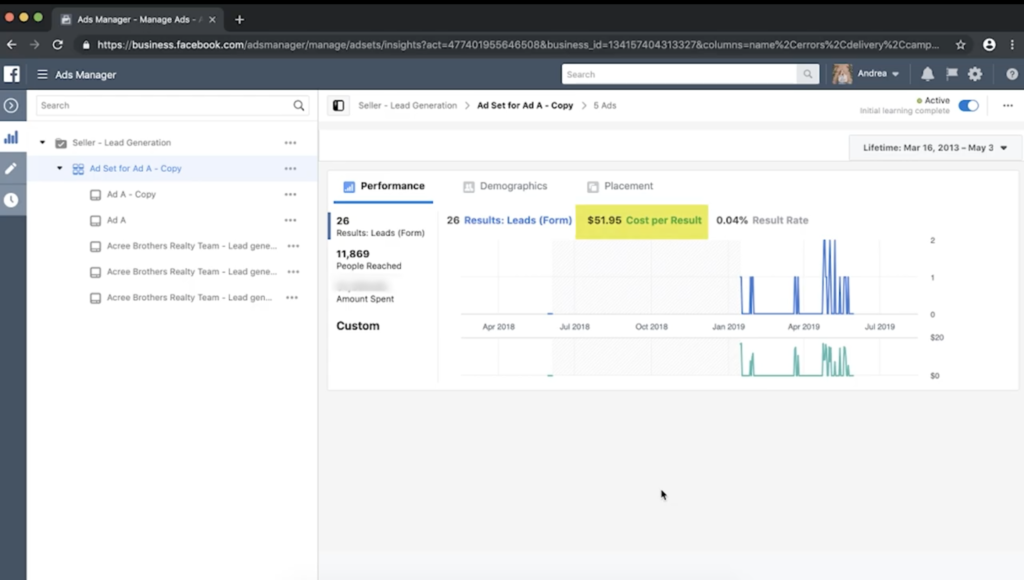
Right above the graph, you’re going to see your Cost Per Result. This is essentially your ROI. You can take this number and measure it against future and past campaigns to determine your success. As you might have guessed, this will vary from ad to ad—and depending on what industry you’re in—but, the lower the cost per result, the better.
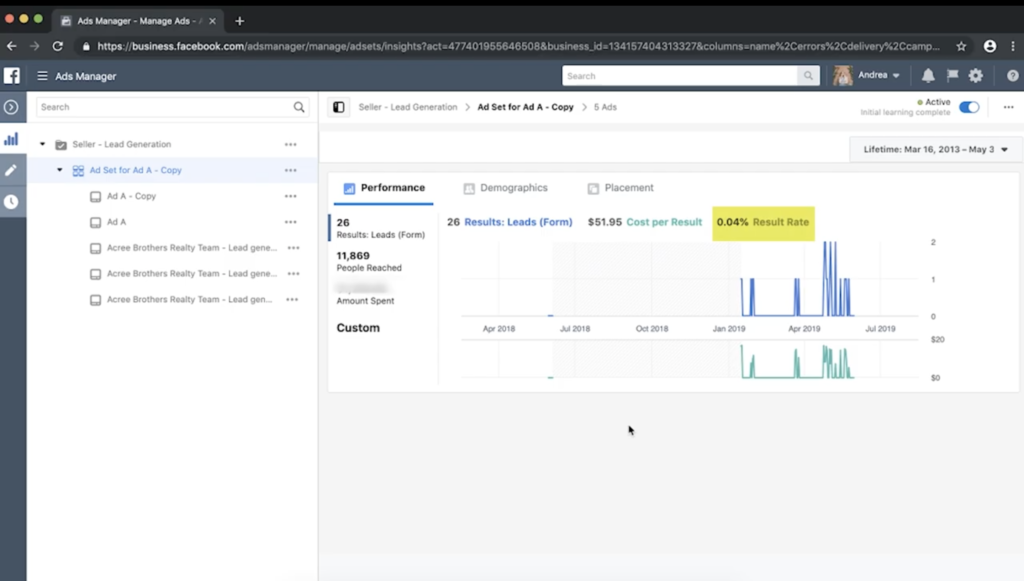
You’re also going to see your Result Rate to the right of this. This is basically telling you how many people saw your ad and took the action that you wanted them to take, based on your objective. This will also vary depending on your ad, and some objectives are more difficult to achieve than others. But you generally want to go by the rule of thumb that it should stay the same or increase on different ads.
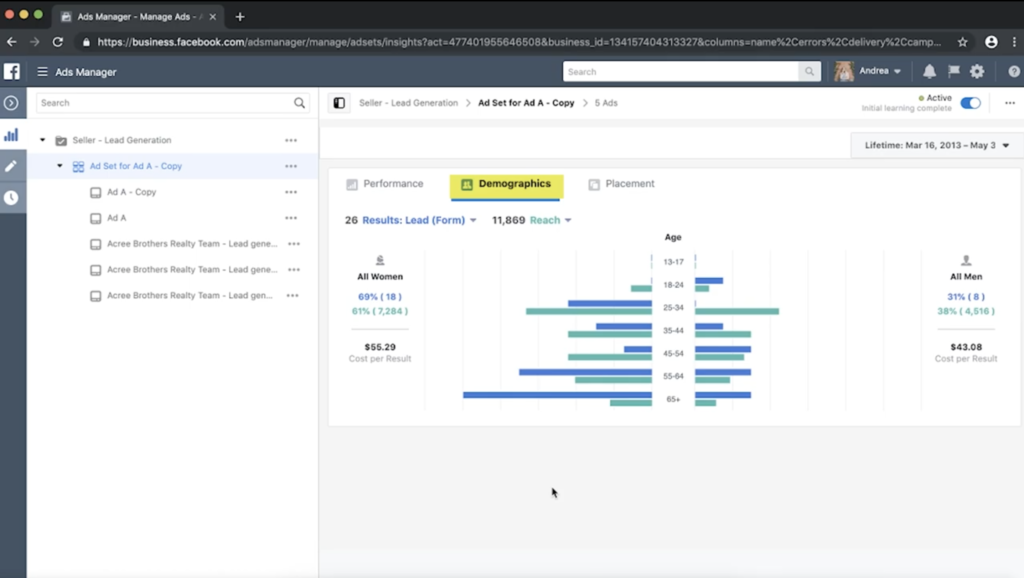
All of these numbers that we’ve been looking at so far are under the Performance tab. But, if you click the Demographics tab, you’re going to see a breakdown of men and women who saw your ad. The blue numbers and bars on the bar graph represent the total men and women who saw your ad versus the turquoise, which represents the total number reached who saw your ad.
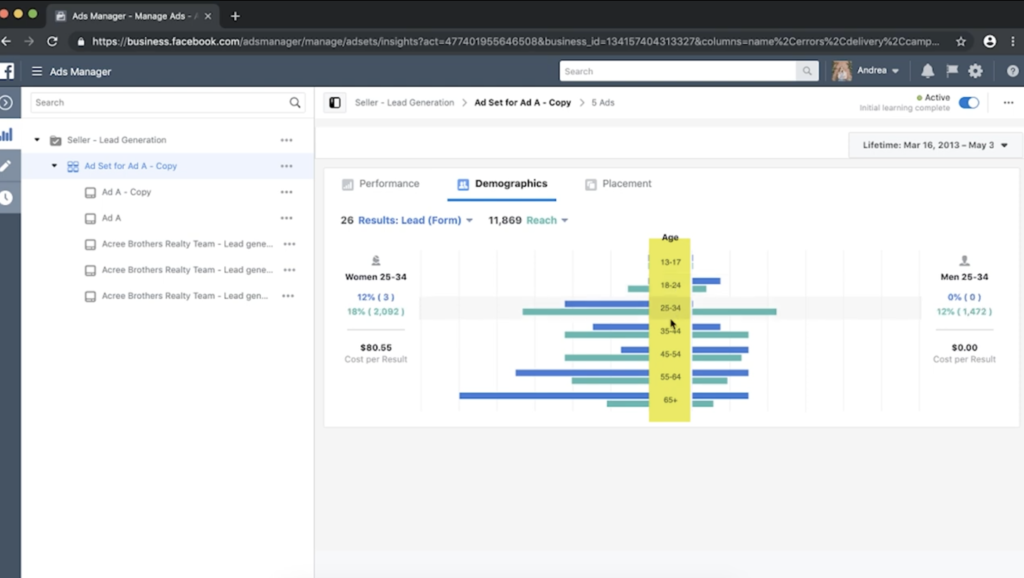
On the left side of this graph, you’re going to see the total number of women who saw your ad versus the right side, which is total number of men. If you hover your cursor over the individual age ranges, these demographics are broken down even further for you.
Download a PDF sample of American Lifestyle to stay in touch with past clients.
For example, we can see here that 8 percent of women were ages 35 to 44, versus 4 percent of men who are the same age range. You can use this information to figure out what age range your ads are connecting with, and then better leverage that information for your business.
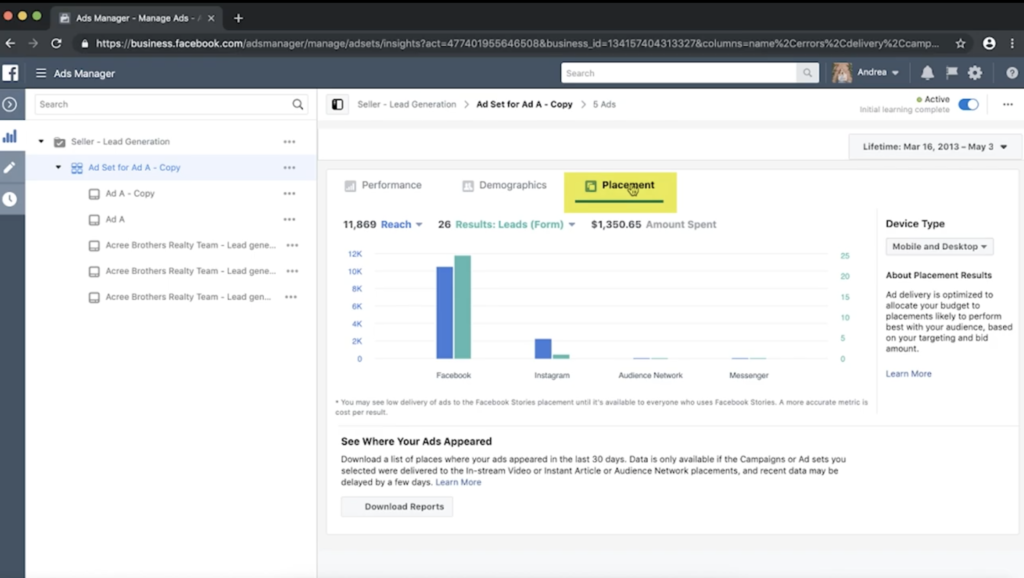
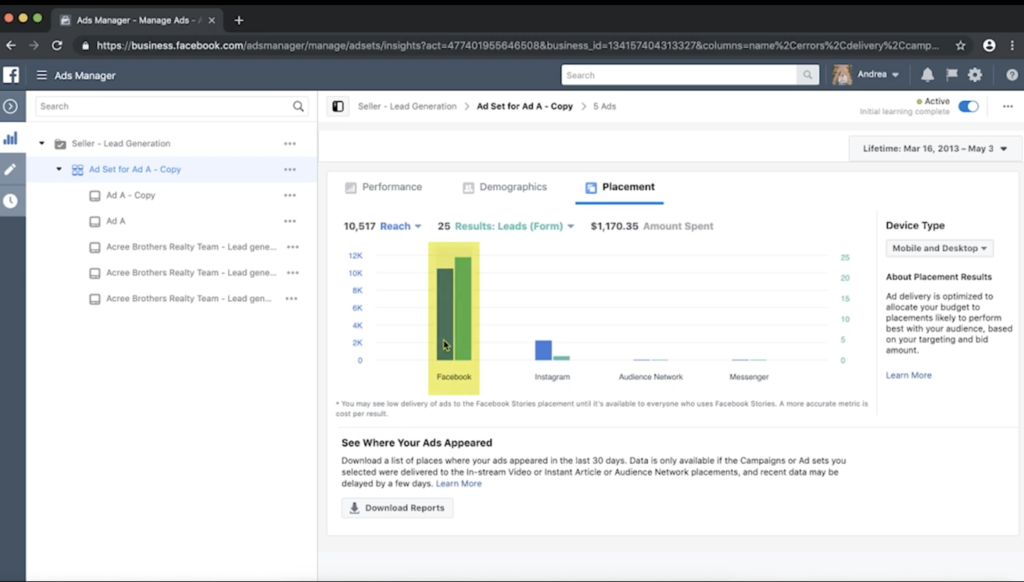
Finally, you can click the Placements tab to see where everybody engaged with your ad and what platform they were on. Just move your cursor over each bar on the bar graph to view the different results from Facebook and the different results from Instagram. You can use this information to see how effectively your ads ran on Facebook and Instagram. (For example, this ad is performing much better on Facebook than Instagram.) So, going forward you can actually decide whether to include or exclude Instagram in your future ads.
The takeaway
Now that you know how to check the performance of your Facebook ads you can get a better idea of what drives success for your business. For more tips, be sure to follow this YouTube channel. Find us on Facebook and Instagram: @remindermedia. But, most importantly, put a pin in it.